

How to Show Traction: B2B vs D2C vs AI Startups?
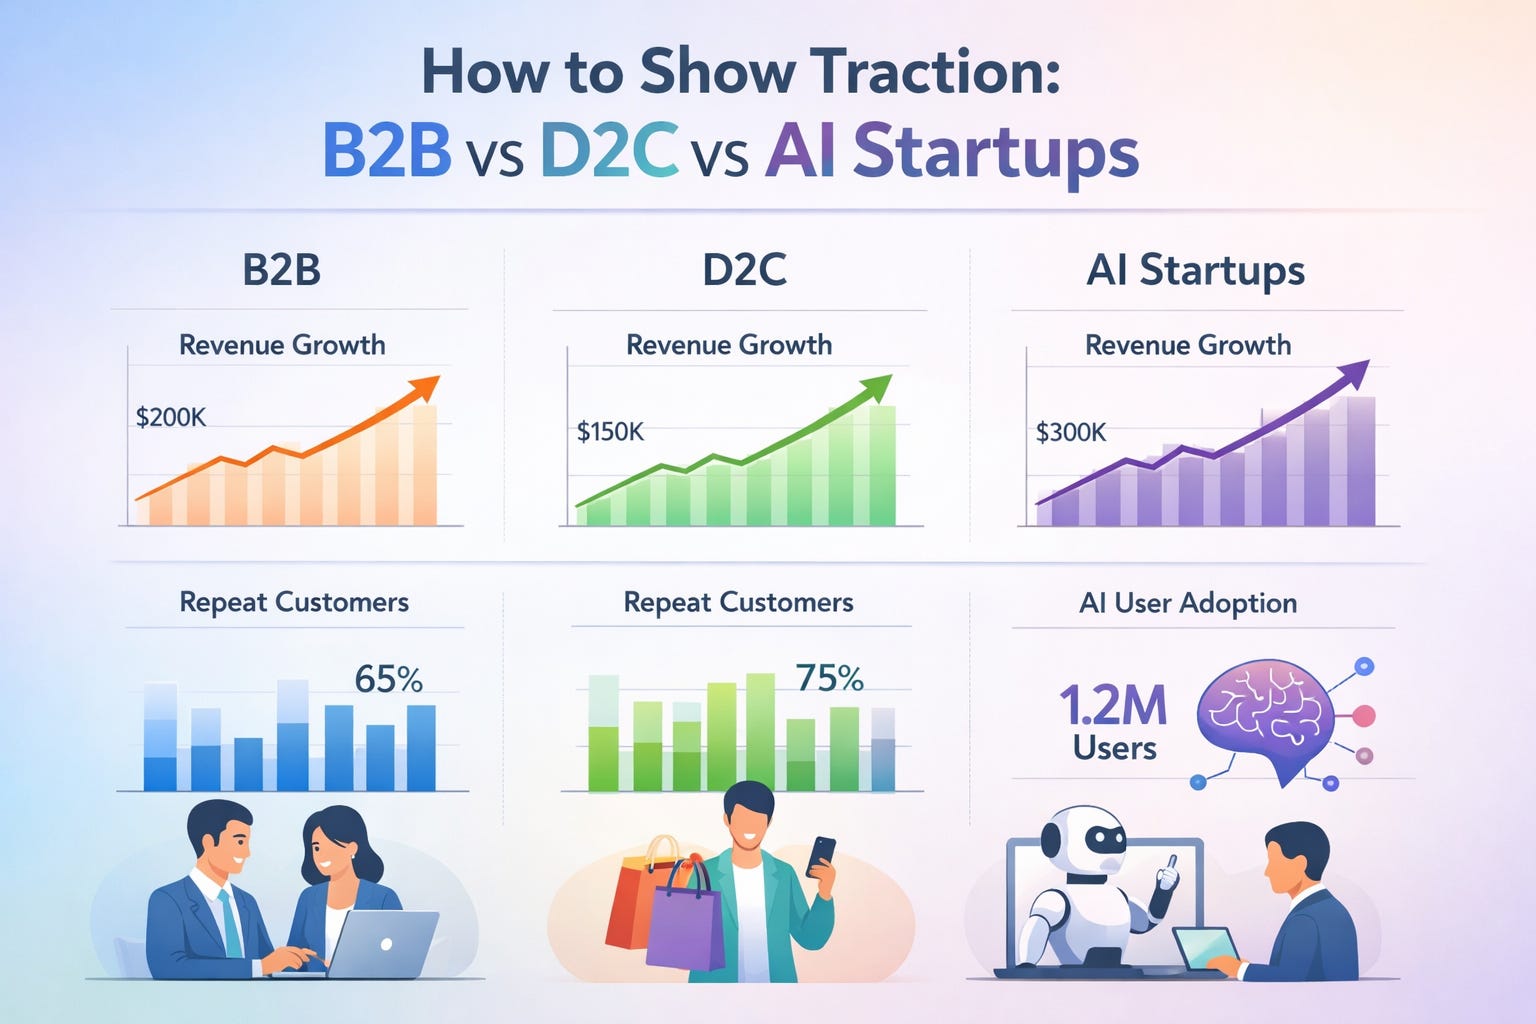
Traction shows that a startup is gaining real momentum. But traction can look very different depending on the type of startup. Let’s explore how it appears across B2B, D2C, and AI startups.

Traction is one of the most important signals founders present to investors, partners, and early customers. It answers a simple question: Is the market validating what you’re building?
But traction does not look the same for every startup.
A B2B SaaS company selling to enterprises shows traction very differently from a D2C brand selling skincare online. And AI startups today often demonstrate traction through usage, models, and integrations, not just revenue.
This article explores how traction is measured across B2B, D2C, and AI startups, and which signals investors actually look for in each category.
What Traction Really Means?
At its core, traction is evidence that the market wants what you’re building. It shows that customers are not just aware of the product, but are actively trying it, using it, and also paying for it. For early-stage startups, traction helps reduce uncertainty by demonstrating that the product is solving a real problem.
In most cases, investors evaluate traction through three broad signals:
1. Demand
Demand shows whether customers are discovering and trying the product. This can appear as user signups, product trials, demo requests, waitlists, or early sales.
2. Retention
Retention measures whether customers continue using the product after the initial experience.
3. Revenue or Value Creation
Revenue is often the most direct signal of traction. When customers are willing to pay, upgrade, or use, it demonstrates real economic value.
Traction can look very different depending on the type of startup- B2B, D2C, or AI- so let’s take a closer look at how it shows up in each case.
Traction for B2B Startups
B2B startups typically sell to companies, which means longer sales cycles but higher contract values. Because of this, traction often focuses on revenue predictability and customer relationships.
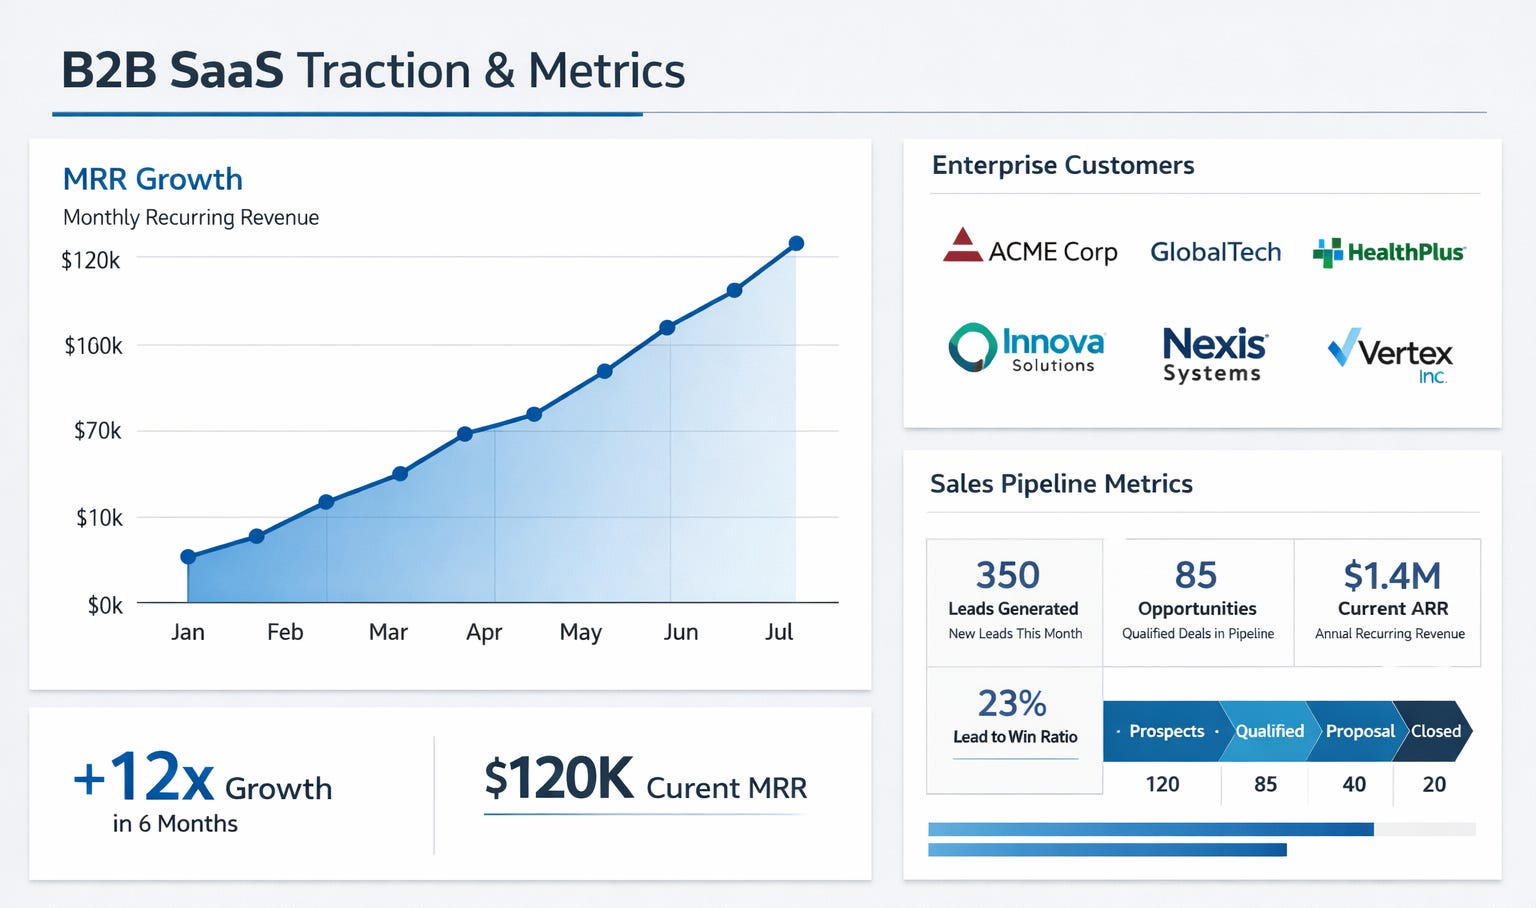
1. Monthly Recurring Revenue (MRR)
MRR is the most common metric for SaaS traction. Typical benchmarks investors often look for:
Pre-seed: $5k–$20k MRR
Seed: $20k–$100k MRR
Series A: $100k+ MRR
Even small MRR numbers can signal traction if growth is consistent.
2. Sales Pipeline
If revenue is early, founders often show:
Qualified pipeline value
Number of active pilots
Conversion rate from demo → deal
3. Retention and Expansion
For B2B startups, retention and expansion are among the strongest indicators of traction. One key metric for measuring this is Net Revenue Retention (NRR). NRR tracks how revenue from existing customers changes over time, including upgrades, additional seats, or expanded product usage.
Typical benchmarks include:
NRR above 100% - existing customers are expanding usage, meaning expansion revenue offsets any churn.
NRR above 120% - a strong signal of product value, where customers are significantly increasing their spending over time.
A high NRR suggests that the product is becoming more valuable as customers continue to use it, which is a powerful indicator of product-market fit and long-term growth potential.
4. Usage Inside Accounts
Investors often look closely at product usage within customer accounts to determine whether the product delivers consistent value across teams or departments. Common usage metrics include:
Active seats – the number of users actively using the product within a company
Feature adoption – how many customers are using key or advanced features
Daily active users per account – how frequently teams interact with the product
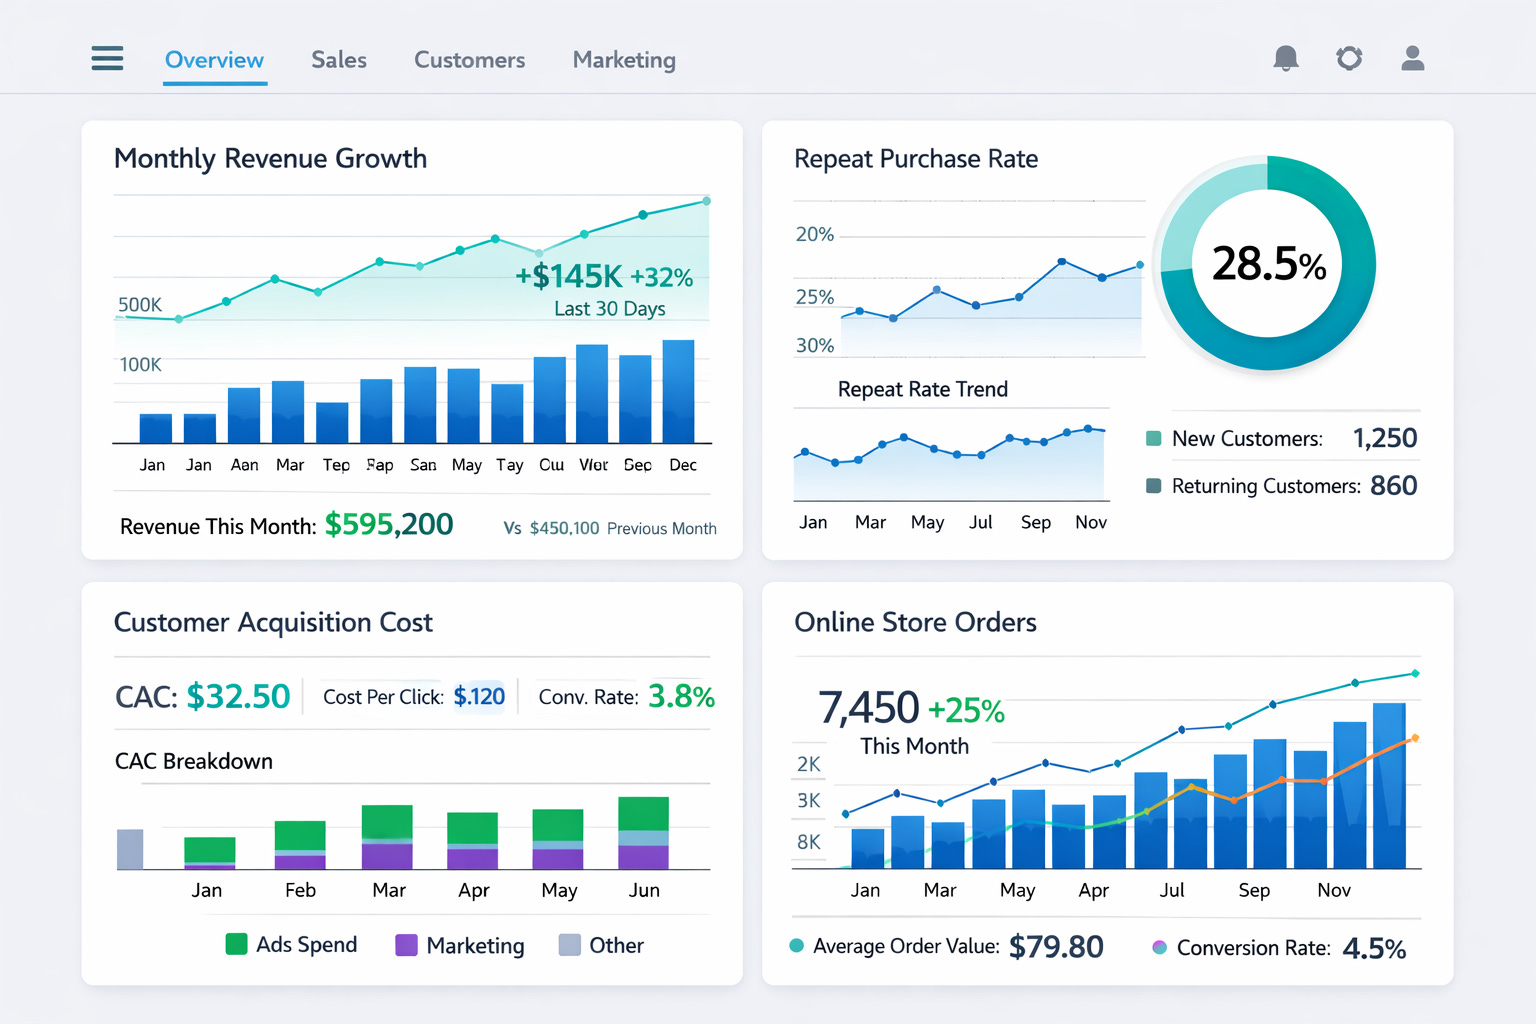
Traction for D2C Startups
For D2C startups, traction is primarily reflected through consumer demand, repeat purchasing behaviour, and sustainable unit economics.
Several metrics help demonstrate traction in D2C businesses:
1. Revenue Growth
Revenue is one of the most visible indicators of traction in consumer businesses. Investors often track monthly revenue growth and sales momentum to understand whether the brand is gaining market acceptance.
Key indicators include:
Monthly revenue or GMV growth
Number of orders
Average order value (AOV)
2. Customer Acquisition Efficiency
Customer acquisition efficiency helps determine whether growth is sustainable or dependent on expensive marketing.
Important metrics include:
Customer Acquisition Cost (CAC)
Lifetime Value (LTV)
CAC payback period
A healthy business typically shows an LTV/CAC ratio above 3, meaning the revenue generated from a customer significantly exceeds the cost of acquiring them.
3. Repeat Purchase Rate
Repeat purchases are one of the strongest indicators of product-market fit in D2C businesses. When customers come back to buy again, it signals satisfaction with the product and growing brand loyalty.
Typical metrics include:
Percentage of returning customers
Purchase frequency
Customer lifetime value
4. Organic Demand and Brand Pull
Another strong traction signal is when customers discover the brand without relying entirely on paid marketing. Organic demand suggests that the brand is gaining recognition and word-of-mouth momentum.
Examples of organic traction include:
Direct website traffic
Social media engagement
Influencer mentions and user-generated content
Referral-driven purchases
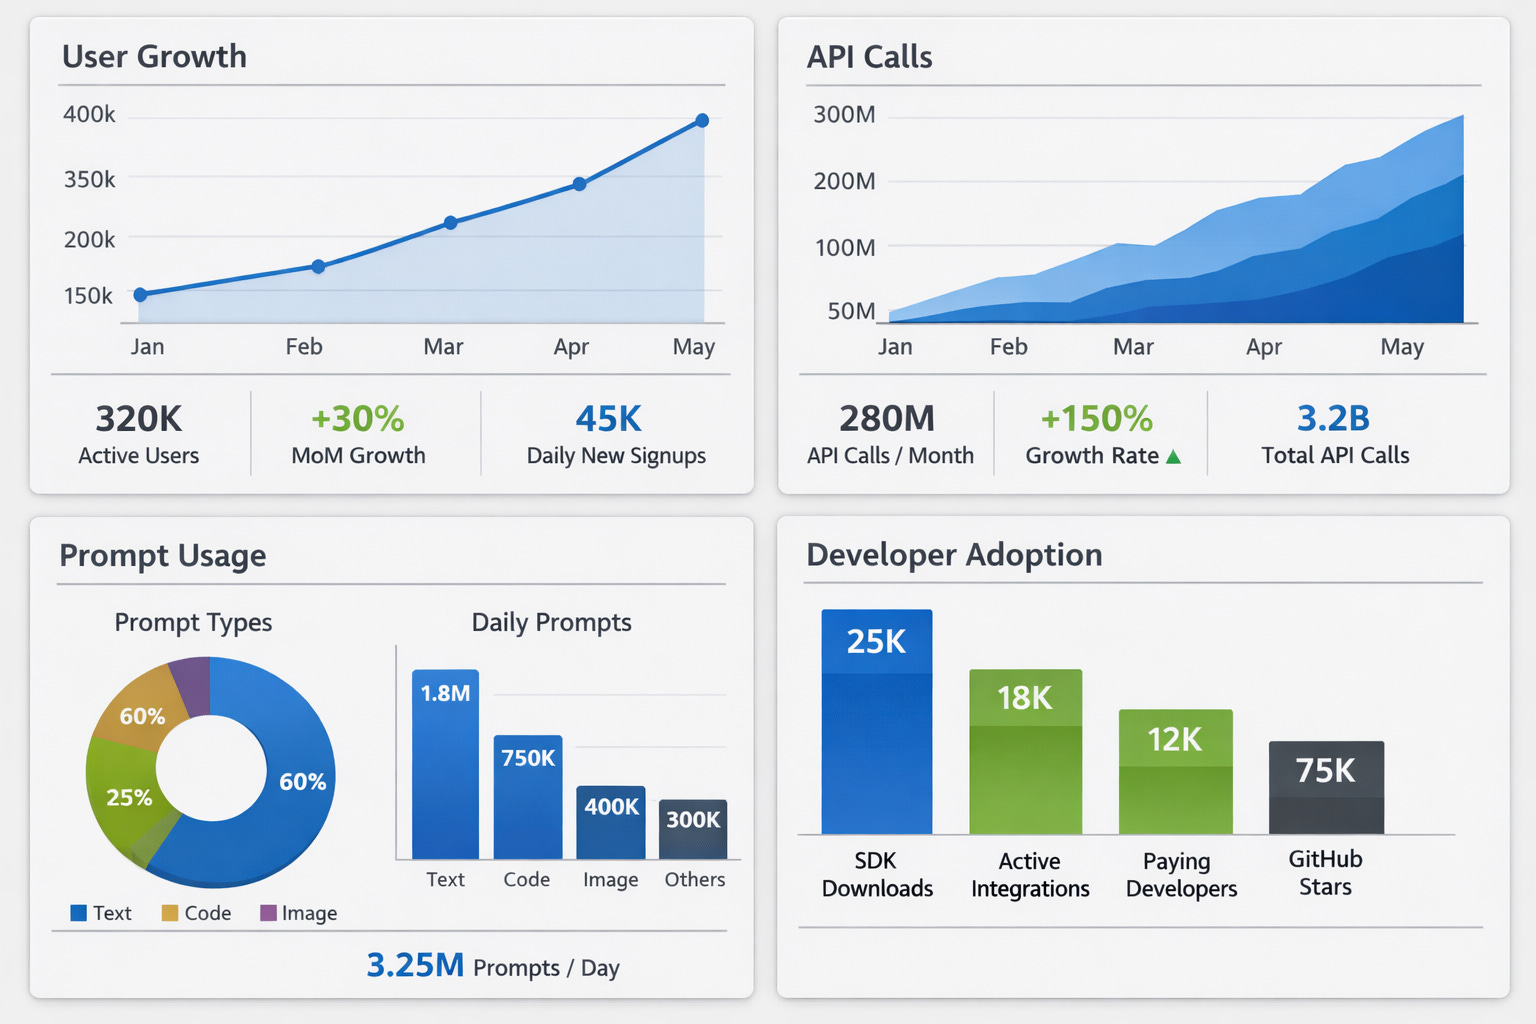
Traction for AI Startups
AI startups often demonstrate traction differently from traditional software or consumer businesses. In many cases, product adoption and usage grow much faster than revenue in the early stages.
As a result, investors frequently evaluate traction through signals such as user engagement, workflow integration, and developer adoption, rather than relying solely on revenue.
Some of the most important traction signals for AI startups include:
1. User Growth and Engagement
User adoption is often the first indicator that an AI product is gaining traction. Investors look for evidence that people are actively interacting with the product and using it regularly.
Key metrics may include:
Daily active users (DAU)
Monthly active users (MAU)
Number of prompts, queries, or tasks completed
2. API Usage and Developer Adoption
For AI infrastructure and platform startups, traction is often measured through developer adoption. When developers build products using an AI platform, it indicates strong demand and ecosystem growth.
Relevant metrics include:
Number of developers using the API
API calls per day or month
Number of applications built on the platform
3. Workflow Integration
The strongest AI products become embedded in daily workflows. When teams rely on AI tools to automate tasks or improve productivity, the product becomes difficult to replace.
Some examples of workflow integration include:
Customer support teams use AI tools to draft or resolve support tickets automatically.
Marketing teams use AI to generate content, campaign ideas, or analyse performance data.
Engineering teams rely on AI copilots to write, review, or debug code.
Sales teams use AI to summarise calls, draft outreach emails, and automatically update CRM notes.
Product teams use AI to analyse user feedback and identify feature insights.
4. Model Performance and Efficiency
AI startups can also demonstrate traction through improvements in model performance and efficiency. These technical advancements often translate into better user experiences and lower operating costs.
Important indicators may include:
Improved accuracy or output quality
Faster inference speeds
Lower cost per query or task
Strong performance improvements can help a startup stand out and stay competitive as the market grows.
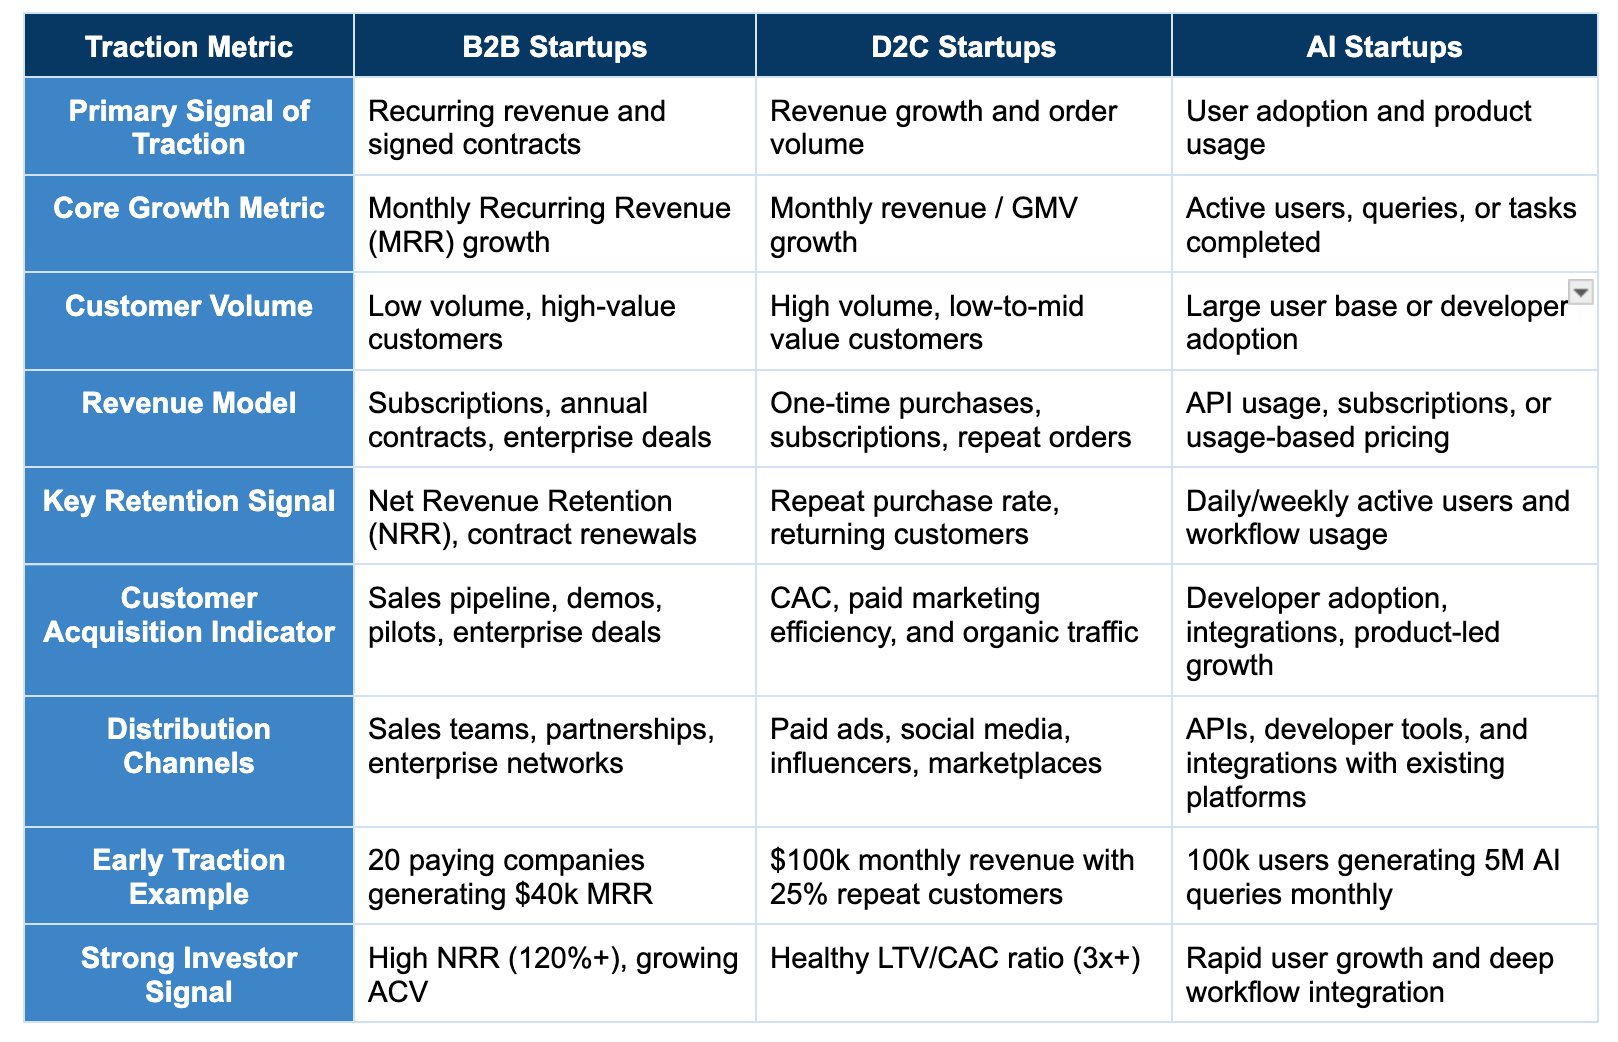
Traction Metrics Comparison: B2B vs D2C vs AI Startups
Final Thoughts
While traction can look different for B2B, D2C, and AI startups, the core signal remains the same: the market is responding. It could show up as growing recurring revenue, increasing repeat purchases, or rapid user adoption. Still, each of these signals tells the same story: people are finding real value in the product.
The most compelling traction stories are usually simple. Instead of presenting dozens of numbers, the goal is to highlight a few meaningful metrics that clearly show progress over time. What starts as a few users or early sales gradually turns into steady adoption, repeat customers, and predictable growth.
That’s when traction becomes more than just a metric on a slide. It becomes the story of a startup proving that its idea works in the real world.
At Razorpay Rize, we get it- building a startup is tough. That’s why we’re more than just a space for connecting with other founders. We’ve got programs, tools, and services designed to take some of the weight off the shoulders and make the journey just a little bit easier.
Curious about how we support startup founders?

Dive into Vault today & unlock a world of possibilities.