

How to Build a 12-Month Financial Model for Your Startup (Step-by-Step Guide)?
This guide walks you through building a simple, practical financial model that helps you forecast revenue, control costs, and plan your runway with confidence.

If you’re a founder, you already know this- numbers don’t lie, but feelings do. Some days you feel like you’re building the next unicorn; other days, one unexpected AWS bill can completely ruin your appetite.
That emotional swing is precisely why a 12-month financial model matters. It keeps you grounded in reality. It shows you exactly where you stand, what’s working, what’s not, how fast you’re burning cash, when you’ll run out of money, and when you really need to hit the fundraising button.
In this article, we’ll break down exactly how you can build a simple, practical 12-month financial model for your startup- step by step.
What is a 12-Month Financial Model?
A 12-month financial model is a month-by-month financial forecast of your startup’s entire business for the following year. It projects how much revenue you are expected to generate, how much you will spend to keep the business running, what your profit or loss will look like each month, and most importantly, how your cash position will change over time.
Unlike a high-level annual projection that hides ups and downs inside a single number, a 12-month model forces you to confront reality every single month.
At its core, this model exists to answer a few non-negotiable survival questions that every founder must have clarity on:
How much revenue can you realistically expect to generate each month?
What will your total monthly expenses look like?
Will you be making or losing money each month, and how fast?
How much cash will be left in your bank account at the end of every month?
If nothing changes, when exactly will you run out of money?
To answer these questions clearly, a 12-month financial model is usually built using five core building blocks, each stacked on top of the other in a logical flow:
Revenue Forecast
A month-by-month projection of how much money you expect to earn from customers, broken down by product, plan, or channel.Cost Structure (Fixed + Variable)
A complete breakdown of what it costs to run the business, both expenses that stay constant every month and those that rise as revenue grows.Profit & Loss (P&L)
A monthly view of whether your startup is operating at a profit or a loss after accounting for all expenses.Cash Flow Statement
A tracking of how money actually moves in and out of your bank account, helping you understand real liquidity.Runway Calculation
A simple but robust view of how many months your current cash will last at your current burn rate.
Step 1: Start With Clear Business Assumptions
Before you even open Google Sheets or Excel, the first step in building a 12-month financial model is to define your business assumptions.
In the early days, you may not have all the data, so assumptions will evolve. These are simply your best current understanding of how your startup operates and grows.
For example, if you’re building a SaaS product, your assumptions include factors such as pricing, sign-up growth, churn rate, and expansion revenue. If you’re building a D2C brand, you’ll focus on website traffic, conversion rates, repeat purchase cycles, and average order value. These assumptions define how revenue is expected to grow.
Here are some assumptions to consider as a starting point.
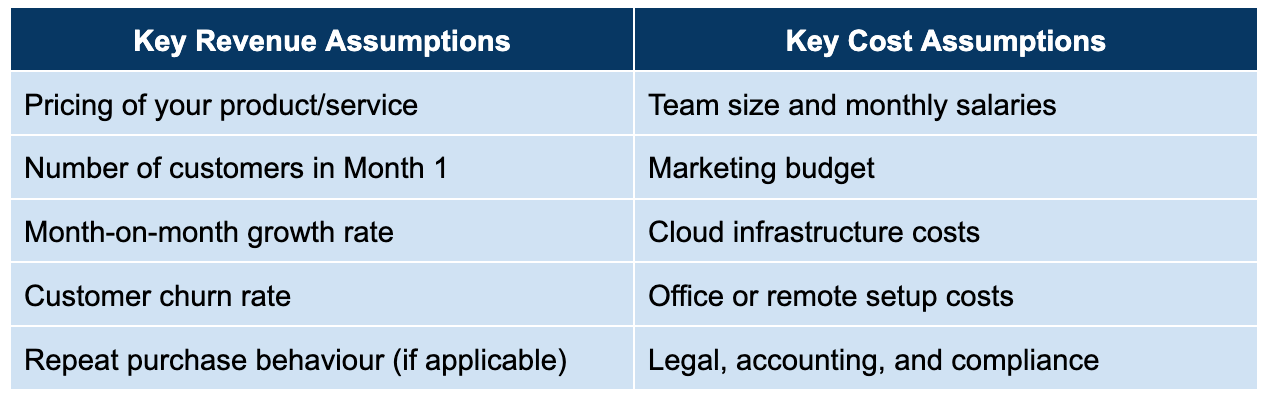
These assumptions remain editable and should evolve every quarter.
Step 2: Structure Your 12-Month Financial Model Sheet
Your financial model should always follow a clean, layered structure so that numbers flow logically from top to bottom.
The easiest and most founder-friendly way to structure your model is to use one main sheet with multiple vertical sections instead of scattering everything across dozens of tabs. Each column should represent one month- Month 1 to Month 12. Each row should represent a single financial line item: revenue streams, cost heads, or totals. This makes your model easy to scan visually and quick to update when real numbers start coming in.
Your sheet should be structured in five core blocks, stacked from top to bottom:
At the top sits your Revenue Forecast. This is where you define how money enters your business- customers, pricing, orders, subscriptions, or deals.
Below that comes your Variable Costs. These are the expenses that increase as your revenue grows, such as payment gateway fees, cloud usage, logistics, packaging, or commissions.
Next comes the Fixed Cost Structure. This is where your monthly burn becomes visible in black and white. Salaries, office rent, tools, marketing retainers, and compliance costs all live here.
Once revenue and costs are defined, your sheet should auto-calculate the Monthly Profit & Loss (P&L). It shows whether your startup is moving closer to sustainability or deeper into losses.
Finally, at the bottom of the sheet sits the most important block of all: Cash Flow & Runway. This section tracks how money actually moves in and out of your bank account. It tells you exactly how much cash you’ll have left at the end of every month and how many months your startup can survive at the current burn rate.
Another essential principle while structuring your model is to separate logic from results. Your assumptions should ideally sit in a clean, clearly marked area at the top or on a separate “Assumptions” tab. Your actual monthly calculations should reference those assumptions automatically.
Once your startup goes live, every month you should replace projected numbers with real ones (Planned vs. Actual).
Step 3: Build the Revenue Forecast
A strong revenue forecast always starts bottom-up, not top-down. Instead of asking, “How big can this become?”, you ask, “How exactly does one rupee enter my bank account today?” That means clearly understanding your pricing, customer acquisition, buying behaviour, repeat usage, churn, and sales cycles.
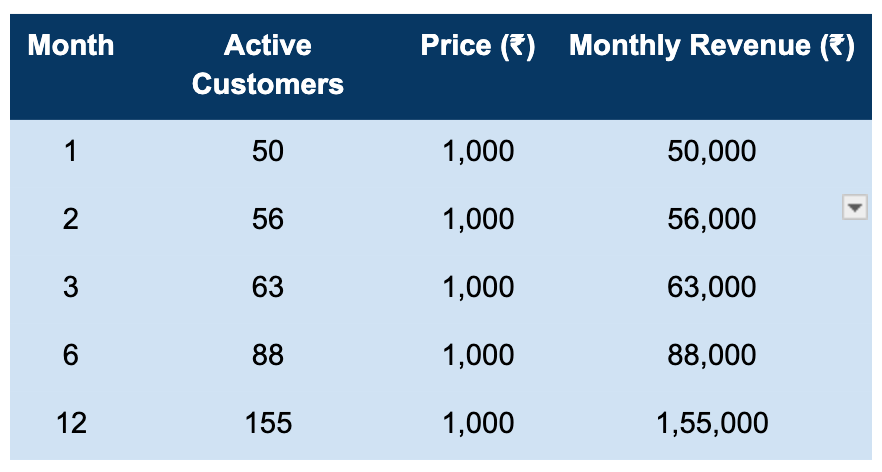
For SaaS founders, revenue is driven by how many users you acquire every month, how many churn, and how much each customer pays you.
Example:
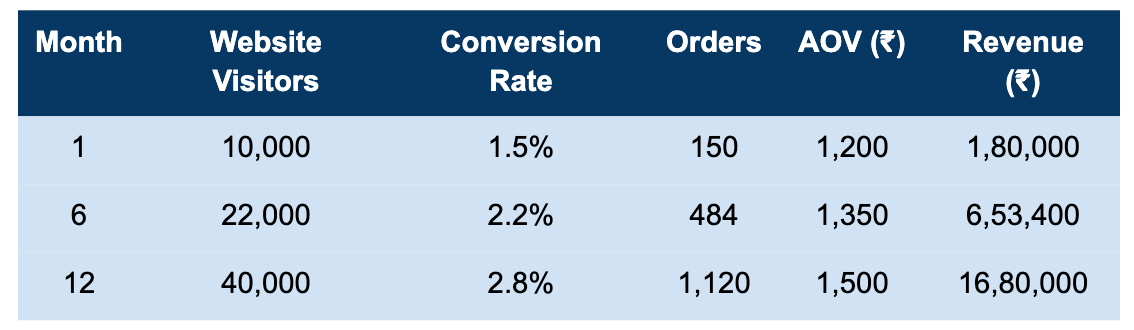
For D2C founders, revenue behaves very differently. It depends on traffic, conversion rate, average order value, repeat purchases, and seasonality.
Example:
Most first-time founders assume 20–30% month-on-month growth without understanding what it takes to sustain that. In reality, growth usually comes in waves- slow in the beginning, slightly faster with traction, uneven during scaling. A realistic model shows step-ups, plateaus, and occasional slowdowns.
Step 4: Map Your Variable Costs
Once you’ve built your revenue forecast, the next step is to map out your variable costs- the expenses that rise and fall with the amount of business you do. Unlike fixed costs, which stay the same every month regardless of activity, variable costs scale directly with your revenue, orders, or usage.
Standard variable costs by startup type:
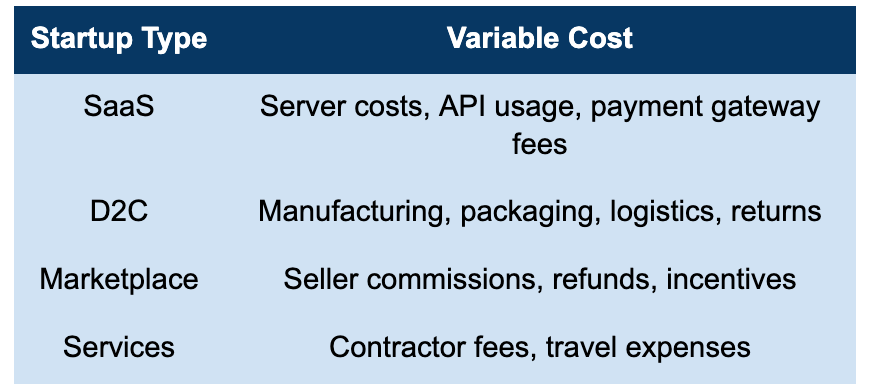
Variable costs help you calculate your gross margin, which is one of the most critical numbers in your entire financial model. Gross margin shows how much money you actually keep after the cost of delivering your product or service.
Step 5: Build the Fixed Cost Structure
Fixed costs are the part of your startup that shows up every single month, no matter how good or bad business is going. This is the baseline amount your startup needs just to exist. Salaries, office rent, core software tools, retainers, compliance, and recurring operational expenses all fall into this bucket.
In your 12-month financial model, the fixed cost section is what defines your monthly burn rate. Once this number is locked in, every other decision becomes easier to evaluate. If a new hire increases your burn by ₹1,50,000, your runway shortens immediately. If you downgrade office space, your runway extends. The cause-and-effect relationship becomes visible here.
Most importantly, your fixed cost structure should never be static. As your startup evolves, so will this section.
Step 6: Create the Monthly Profit & Loss (P&L) Statement
If revenue shows your ambition and costs show your discipline, then the Profit & Loss (P&L) statement shows your reality. This is the section of your 12-month financial model that brings everything together- how much you earn, how much you spend, and what’s actually left at the end of every month.
The P&L tells you whether your startup is profitable or burning cash every month.
Your monthly P&L is built in an immaculate flow. First comes revenue at the top. From that, you subtract your variable costs to arrive at your gross profit. This shows how much money remains after delivering your product or service.
From gross profit, you subtract your fixed costs, salaries, tools, rent, and operational expenses to arrive at your net profit or net loss for the month. In your early days, you will often end up with a net loss, but this will evolve over time.
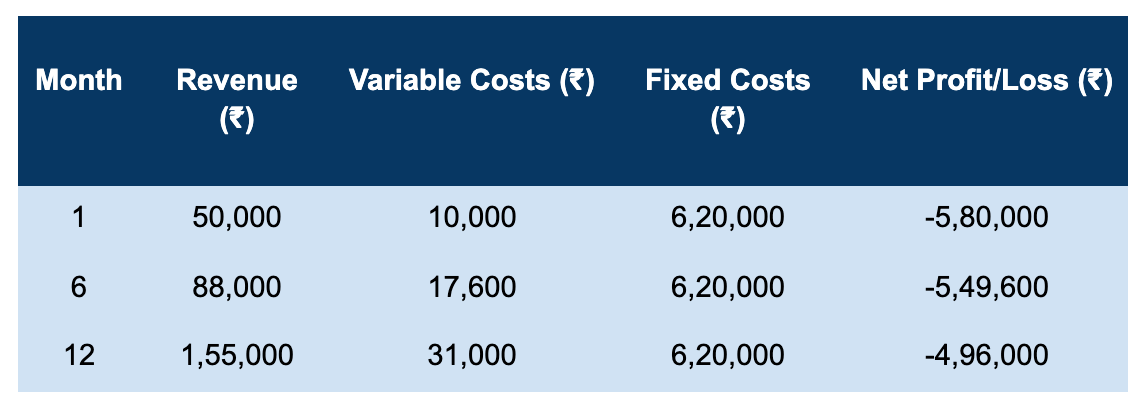
Another powerful use of the P&L is trend analysis. When you line up 12 months of P&L side by side, patterns start to emerge. You see whether revenue is compounding or stalling.
Step 7: Build the Cash Flow & Runway Tracker
A proper cash flow model tracks three key elements every month: the opening cash balance, cash inflows, and cash outflows. The closing balance then becomes the opening balance for the next month.
And, runway is the output. It is the number of months your startup can survive at the current burn rate with the cash you already have. And yet, despite how simple the idea sounds, most founders don’t track it properly.
Runway = Cash ÷ Monthly Burn
If your average monthly burn is ₹6,00,000 and you have ₹30,00,000 in the bank: Runway = 5 months
Step 8: Track Core Startup Metrics Inside the Model
Once your revenue, costs, P&L, and cash flow are in place, your financial model stops being just a forecasting sheet and starts becoming a decision-making engine.
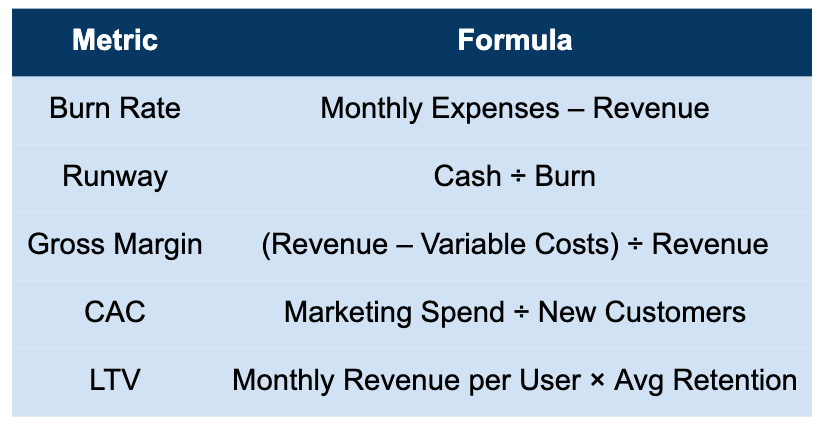
In simple terms, your financial model tells you where your startup is today, but your metrics tell you where it’s heading and how fast.
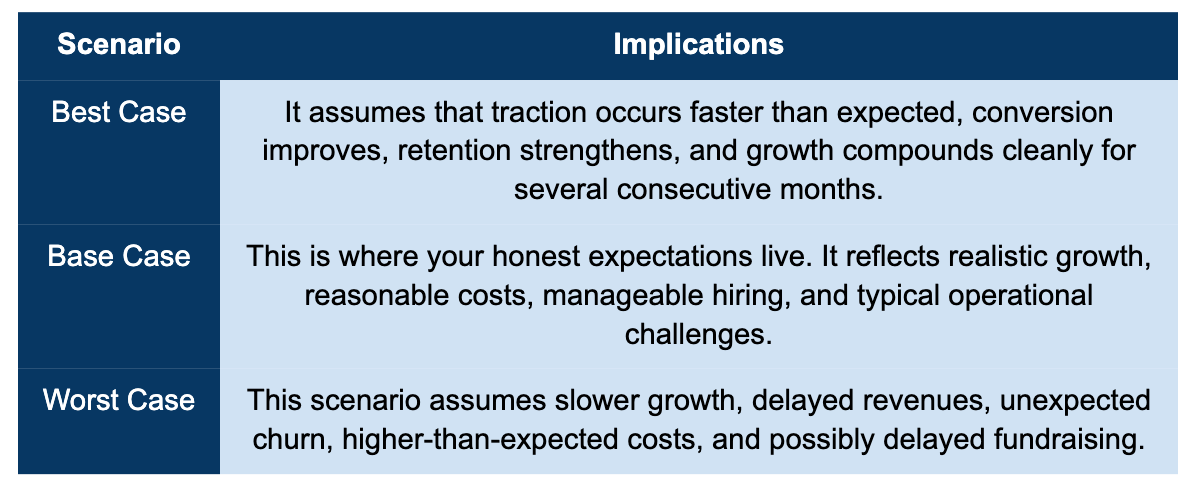
Best Case, Base Case & Worst Case Scenarios
Building just one financial model assumes that life will follow a straight line. It never does. That’s why every founder should build three versions of the same 12-month model: Best Case, Base Case, and Worst Case.
How Investors Read Your 12-Month Financial Model?
A 12-month financial model, when done well, becomes a window into how you run your business when no one is watching.
The first thing investors look for is a logical structure. They check whether your revenue assumptions connect cleanly to actual inputs like pricing, customer count, conversion, and churn.
Next, they focus heavily on your gross margins. This tells them whether your business has the potential to become highly profitable at scale or whether it will always struggle to make money no matter how big it gets. Strong gross margins signal scalability.
After that, their attention goes straight to your burn rate and runway. This is the real risk lens. Investors don’t want to back startups that are constantly running at the edge of collapse.
When your numbers tell a coherent story, investors feel that you will treat their capital with responsibility. And once that trust is built, everything else- valuation, terms, support- becomes a far easier conversation.
Final Thoughts
A 12-month financial model is not built for investors, accountants, or pitch decks; it is built for you, the founder. When everything feels uncertain- markets, customers, hiring, fundraising, your financial model is the one thing that does not lie. It tells you how much time you really have, how fast you’re burning it, and what you can actually afford to do next.
When it comes to building your 12-month financial model, you don’t need complex or expensive software. Simple tools work best- Google Sheets or Excel are more than enough for most founders to build, update, and share their models. You can also start with CFO-in-a-Box templates or financial modelling templates from VC blogs to save time and get the structure right.
Remember, you’ll always have ideas. What you won’t always have is cash, so build your financial model with that truth in mind.
At Razorpay Rize, we get it- building a startup is tough. That’s why we’re more than just a space for connecting with other founders. We’ve got programs, tools, and services designed to take some of the weight off the shoulders and make the journey just a little bit easier.
Curious about how we support startup founders?

Dive into Vault today & unlock a world of possibilities.