


Most early-stage founders don’t struggle with getting traffic; they struggle with knowing where it comes from. A link gets shared in a WhatsApp group, a social post gains traction, three people sign up, but no one knows what actually drove those conversions.
Analytics doesn’t need a data team or a ₹50,000-a-month subscription. It needs a few free tools set up once, links that carry their own labels, and one simple dashboard to review every Monday.
The flow is straightforward:
Install GA4 → Connect Search Console → Tag your links → Watch behaviour → Ask AI → Build one dashboard → Review weekly
The Stack
You’re not trying to measure everything. You’re trying to answer four questions: where do people come from, what do they do, what makes them act, and is any of it growing?
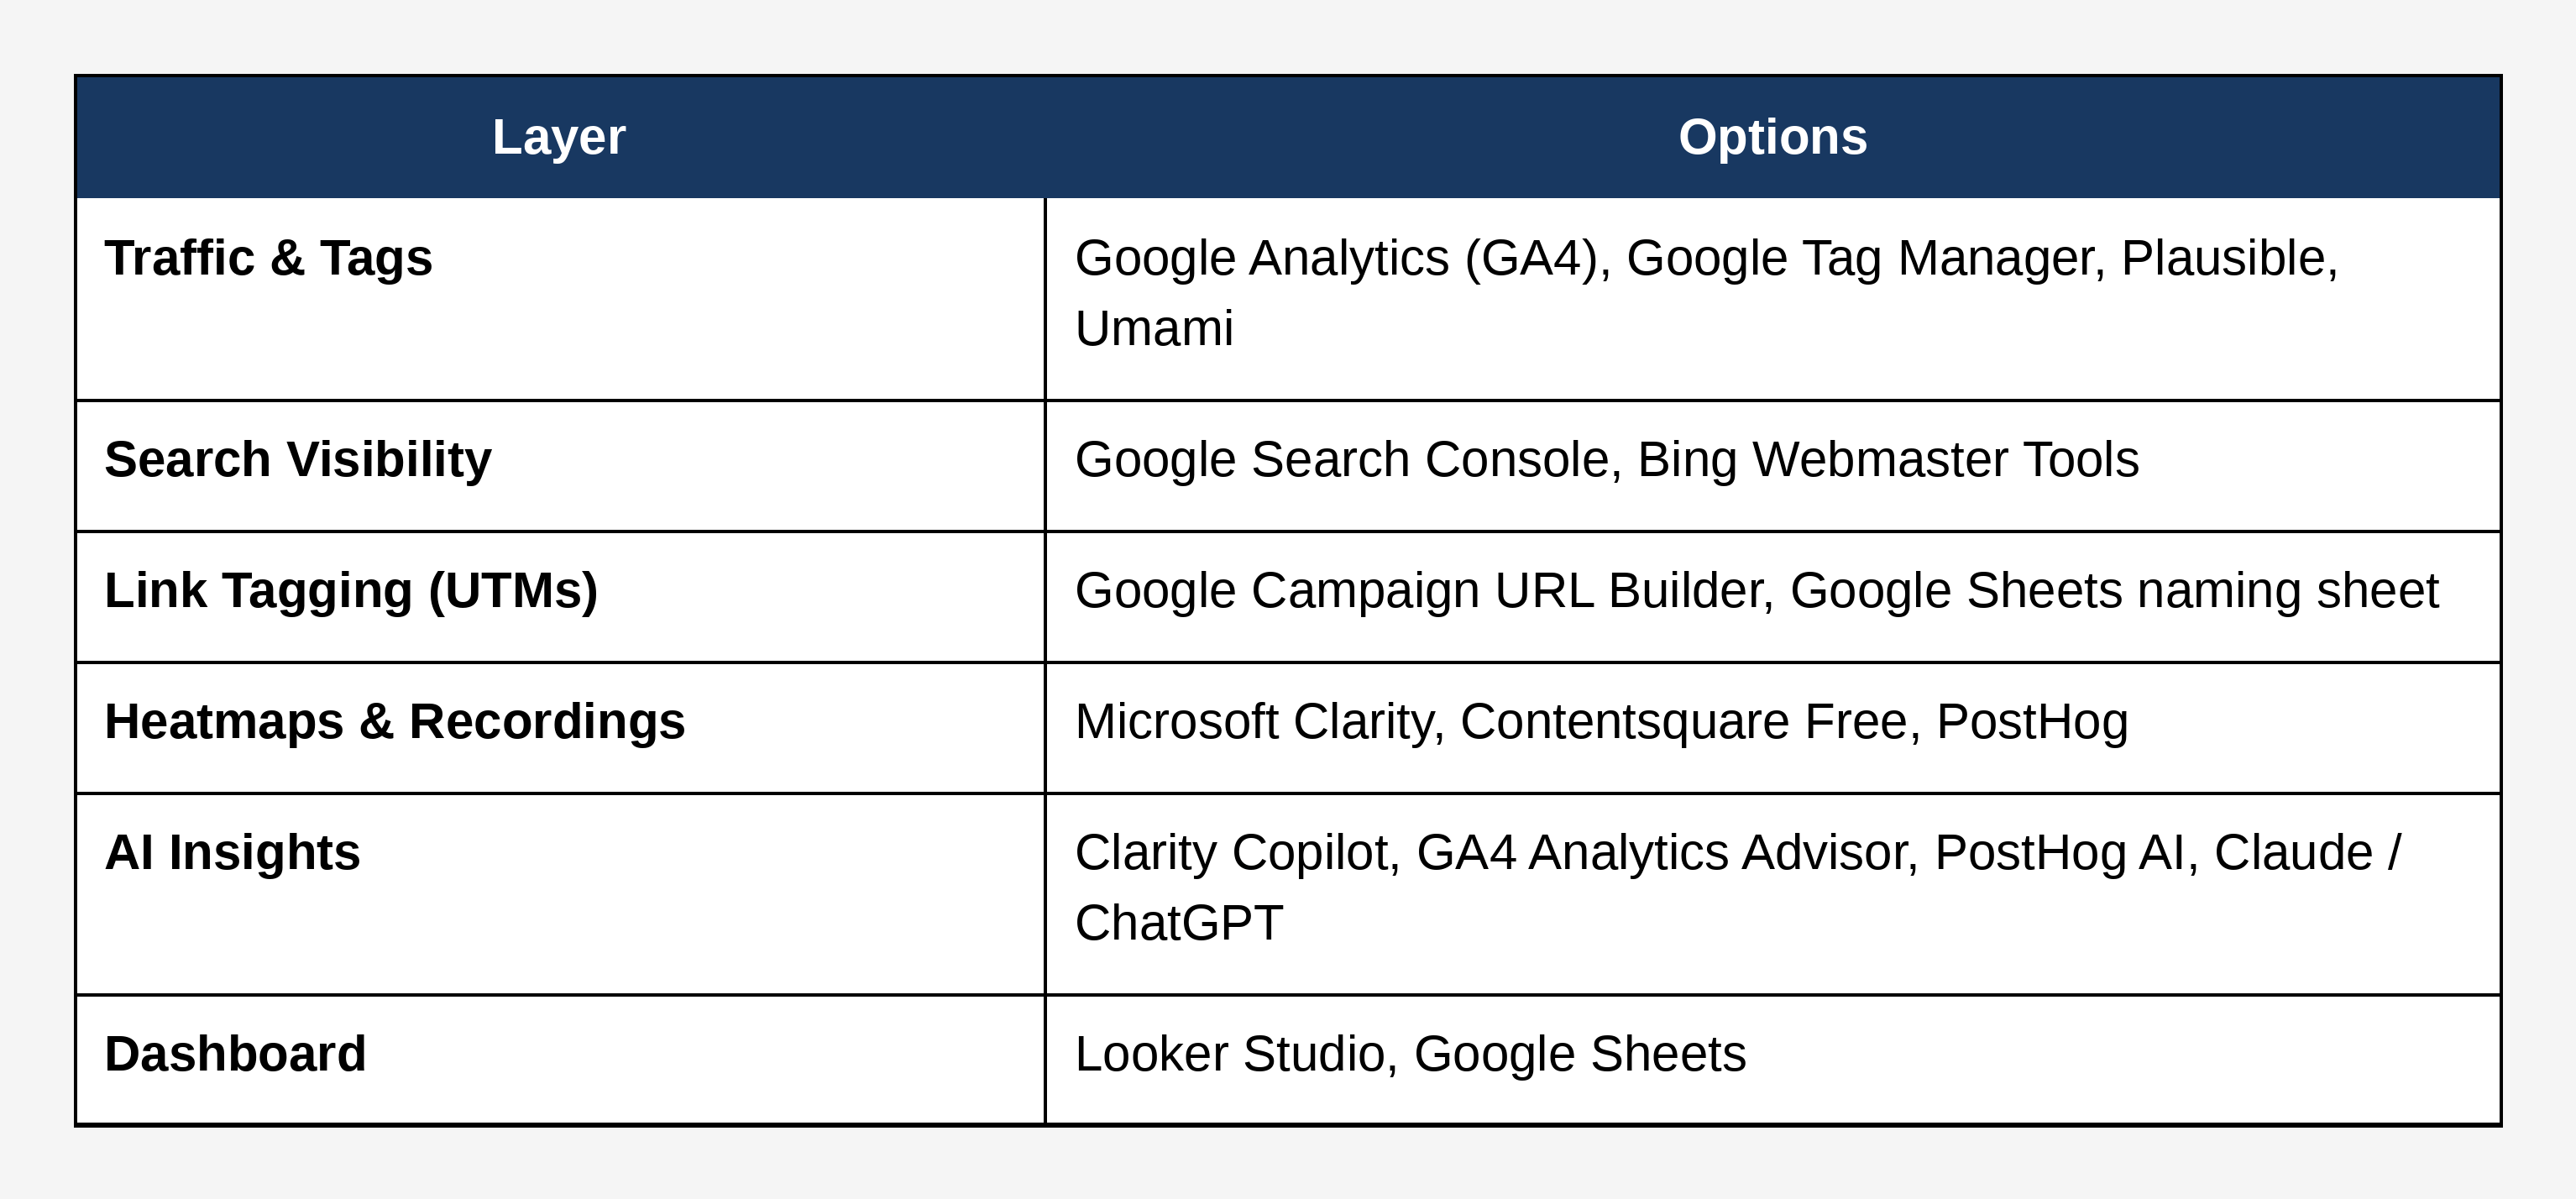
Traffic Basics
• Google Analytics 4: Free, and the default for a reason. It shows where visitors come from, which pages they read, and which actions count as conversions. One setting to change on day one: standard properties keep explorations and funnel data for only two months by default. Switch it to 14 months. It applies going forward only, so do it now.
• Google Tag Manager: Free. It lets you add or change tracking, like button clicks and form submissions, without editing your site’s code each time.
• Plausible / Umami: Lighter, privacy-friendly alternatives if GA4 feels like too much. Plausible’s hosted plans start at around $9 a month. Umami is free if you host it yourself, but the server and upkeep are on you.
Search Visibility
• Google Search Console: Free. It shows which searches bring people to your site, which pages Google has indexed, and where you’re stuck. It keeps about 16 months of performance data on a rolling window, so export anything you want to compare year on year.
• Bing Webmaster Tools: Free, and it takes two minutes if you import your site straight from Search Console. A small share of traffic, but it also feeds a few AI search tools.
Tagging Your Links
• Google Campaign URL Builder: Free. Fill in source, medium, and campaign, and it gives you a link GA4 can sort correctly. Term and content are optional extras.
• A simple naming sheet: A Google Sheet with three columns, source, medium, and campaign, and one rule: everything lowercase. “Email” and “email” show up as two different rows in your reports.
Heatmaps & Recordings
• Microsoft Clarity: Free with no traffic limits, and it includes heatmaps and session recordings. Recordings are kept for 30 days, with favourited ones kept for up to nine months. For a zero-budget stack, start here.
• Contentsquare Free: The free plan covers up to 200k sessions a month, with heatmaps, replays, and funnels. The catch is one month of data and replays captured for only 5% of sessions, up to 10k. Good for a second opinion on one key page.
• PostHog: Free up to 1 million events and 5,000 session recordings a month, with web analytics included and one year of data kept. A better fit once you have a product people log into, not just a landing page.
AI-Powered Insights
• Microsoft Clarity Copilot: Included in Clarity at no extra cost. It writes plain-language summaries of single sessions, groups of up to 250 recordings, and heatmaps, and Clarity Chat lets you ask questions about your data. It doesn’t cover mobile app sessions or sessions under five seconds, and Microsoft warns that summaries can occasionally be wrong.
• GA4 Analytics Advisor: A Gemini-powered assistant inside GA4 where you ask things like “which channel brought the most sign-ups last month?” in plain language.
• PostHog AI: Builds insights and automates routine analysis. The free tier includes 500 AI credits a month, then $0.01 per credit. Replay vision, which scans recordings for moments you describe, includes 2,500 free credits a month.
• Claude or ChatGPT with a CSV: Export your GA4 and Search Console reports, upload them, and ask what changed, which pages are slipping, and which queries deserve a new article.
• GA4’s AI Assistant channel: Since May 2026, GA4 groups traffic from ChatGPT, Gemini, and Claude into its own default channel. Check it to see whether AI tools are already sending you visitors.
The Dashboard
• Looker Studio: Free. It has built-in connectors for GA4 and Search Console, so one page can show traffic, searches, and sign-ups together. Sign in with the same Google account that owns the Search Console property, or it won’t show up. Its plain-language querying feature needs a paid Pro plan, so skip that one for now.
• A Google Sheet: Often the better choice for the first three months. Five numbers, filled in by hand every Monday, will teach you more than a dashboard you never open.
A sensible starting default: GA4 + Search Console for the basics + Google’s URL Builder with a naming sheet for tagging + Microsoft Clarity and its Copilot for behaviour + a monthly CSV upload to Claude or ChatGPT for deeper questions + Looker Studio for the one-page dashboard.
The Build Checklist
☐ Set GA4 data retention to 14 months on day one: The default is two, and the setting isn’t retroactive.
☐ Verify Search Console before you publish anything: It collects data only once you’re verified, so the earlier you verify, the longer your history.
☐ Define one conversion in GA4: A sign-up, a booked call, a purchase.
☐ Write your UTM naming rules before your first campaign: Lowercase, no spaces, one format for source, medium, and campaign.
☐ Tag every link you control: Newsletters, WhatsApp broadcasts, bio links, partner posts, QR codes. If you shared it, it should carry a UTM.
☐ Install Clarity and read three Copilot summaries first: Then watch ten sessions on your most important page. You’ll spot the confusing button or the form field people abandon faster than any report would show.
☐ Verify every AI insight against the raw numbers before acting on it: Summaries can misread a pattern. Check the report before you change the page.
☐ Keep customer data out of AI tools: Export only aggregated, anonymised numbers. Never upload names, emails, or phone numbers.
☐ Add a cookie consent banner: Consent rules depend on who visits, not where you’re based.
☐ Build the one-page dashboard: Users, top sources, top pages, conversions, and top search queries. Five tiles are enough.
☐ Put a 20-minute review on your calendar every Monday: The dashboard doesn’t matter if nobody opens it.
Measuring Whether It’s Working
Track five signals. Together they tell you whether you’re learning from your data, or just collecting it.
Tagged link coverage: Of the links you shared this month, how many carried UTMs? Anything below nine out of ten means traffic is landing in “direct”, and you’re losing the story of where it came from.
Share of “direct” and “unassigned” traffic: If it’s your biggest bucket, your tagging has gaps. A shrinking number over time means your tracking is getting cleaner.
Conversion rate by source: Not just which channel sends the most visitors, but which one sends people who actually sign up.
AI referral traffic: Visits from AI assistants as a share of total traffic. Even a small number tells you your content is being cited.
Time from question to answer: When someone asks “did that campaign work?”, how long does it take you to answer? If it’s more than five minutes, the dashboard needs work.
At Razorpay Rize, we get it- building a startup is tough. That’s why we’re more than just a space for connecting with other founders. We’ve got programs, tools, and services designed to take some of the weight off the shoulders and make the journey just a little bit easier.


Dive into Vault today & unlock a world of possibilities.